Photos : Engineering : SAP
![A graph showing variation of the annual energy used for appliances and lighting as a function of dwelling area as calculated by BREDEM-12 and SAP 2009](https://ian-scott.net/wp-content/uploads/2013/06/BREDEMvSAP-Appliances-Lighting-150x98.png)
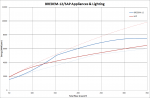
BREDEM-12/SAP 2009 Appliances And Lighting Energy Use Comparison
![A graph showing variation of the annual energy used in cooking as a function of dwelling floor area as calculated using BREDEM-12 and SAP](https://ian-scott.net/wp-content/uploads/2013/06/BREDEMvSAP-Cooking-150x97.png)
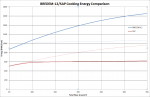
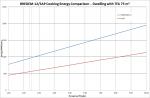
BREDEM-12/SAP 2009 Cooking Energy Comparison
![Graph showing variation of occupancy with dwelling floor area as determined by SAP and BREDEM-12](https://ian-scott.net/wp-content/uploads/2013/06/BREDEMvSAP-Occupancy-150x98.png)
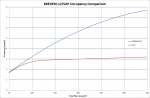
BREDEM-12/SAP 2009 Occupancy Comparison
![Graph showing variation of annual energy used in cooking as a function of occupancy](https://ian-scott.net/wp-content/uploads/2013/06/BREDEMvSAP-CookingOccupancy-150x98.png)
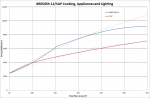
BREDEM-12/SAP 2009 Cooking Energy Usage As A Function of Occupancy for a Fixed Floor Area
![Graph showing variation of annual energy used in cooking and for appliances and lighting as a function of floor area, as calulated by BREDEM-12 and SAP](https://ian-scott.net/wp-content/uploads/2013/06/BREDEMvSAP-Total-150x98.png)