Figure 1: BREDEM-12/SAP Occupancy comparison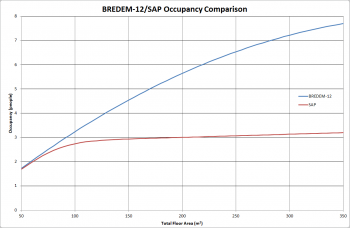
BREDEM-12/SAP 2009 Occupancy Comparison
The first thing to note about BREDEM-12 versus SAP is that they calculate the assumed occupancy of the dwelling differently. Both are dependent only on the total floor area of the building but the numbers arrived at are quite different as the floor area increases as shown in Figure 1. In particular SAP 2009 occupancy levels off to a little over three for reasonable sized dwellings, whereas the BREDEM-12 occupancy increases much more rapidly and doesn’t level off. One could argue that neither seem particularly realistic. It is simple to imagine a dwelling with more than three occupants (particularly if children are being counted—and there is no particular reason they shouldn’t), but the BREDEM-12 numbers perhaps become too large—this is of course ignoring the question of what a non-integer occupancy means!
One might expect that the occupancy difference would affect the energy use in a way that the BREDEM-12 figures would keep increasing whereas the SAP 2009 version would level off. Looking at the annual energy usage for appliances and lighting (Figure 2) this is the case. For comparison purposes I’ve shown as dotted lines the energy calculated from each method using the other’s occupancy (i.e. SAP 2009 calculation with the occupancy set to that found from BREDEM-12 and vice-versa). This shows that BREDEM-12 gives a higher energy usage for a given occupancy, a point made explicit in Figure 3, where energy use determined by each method is compared by increasing the occupancy while holding the floor area fixed.
Figure 2: BREDEM-12/SAP cooking energy comparison Figure 3: BREDEM-12/SAP comparison of cooking energy usage as a function of occupancy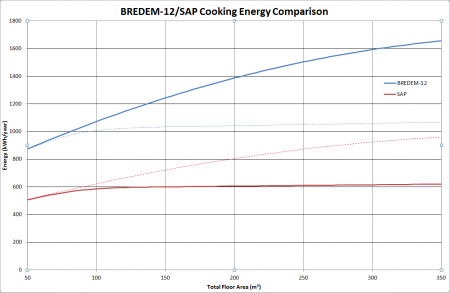
BREDEM-12/SAP 2009 Cooking Energy Comparison
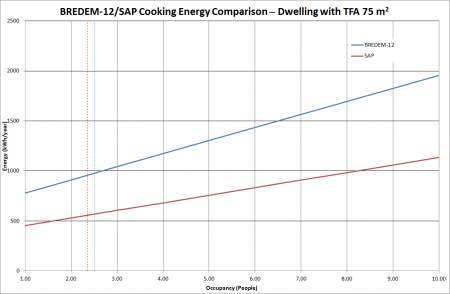
BREDEM-12/SAP 2009 Cooking Energy Usage As A Function of Occupancy for a Fixed Floor Area
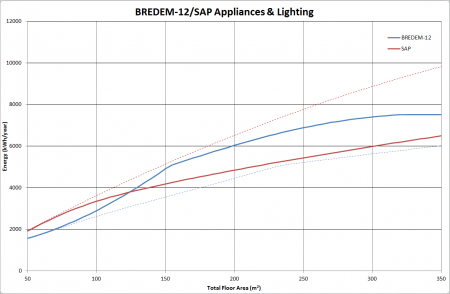
While the cooking energy requirement is therefore simple enough the energy for lighting and appliances (Figure 4) is more interesting. The SAP figures start out higher but the two converge until, at 125 m2 the two are equal, before diverging again. This sort of suggest maybe we’d been underestimating the appliance energy use for smaller dwellings. Perhaps. It’s all a bit of a mess really.
BREDEM-12/SAP 2009 Appliances And Lighting Energy Use Comparison
Figure 4: BREDEM-12/SAP comparison of appliance and lighting energy use
Finally we have Figure 5 which compares the total from cooking, appliances, and lighting energy use from BREDEM-12 and SAP. They’re actually fairly close together, at least until 100—125 m2 which is sort of reassuring.

BREDEM-12/SAP 2009 Cooking, Appliances, and Lighting Energy Use Comparison
Figure 5: Comparison of the total energy usage from cooking, appliances, and lighting as calculated by BREDEM-12 and SAP 2009 for a range of total floor areas
Anyway, there it is. I’m not sure the comparisons tell us much, particularly as BREDEM-12 gets left further and further behind, but it’s out there for the record.
Comments and Pings